Subscriptions - Information
Subscribe to NL Ice Data Pro!

You can directly subscribe by clicking on the 'Subscribe' button at the top of the page!
Or you can either first check what we offer (Learn more) or how you can subscribe (FAQ).
Subscribers - Content
Open access
Players

Goaltenders
Teams


Subscriptions
Subscriptions
History
Find below the list of all our articles published on NL Ice Data.
You can simply filter the table using the fields in each column.
Filters
Table
Choose your table: Standard, Shots, Fouls or Shootouts.
Filters
Players - Statistics
Table
Filters
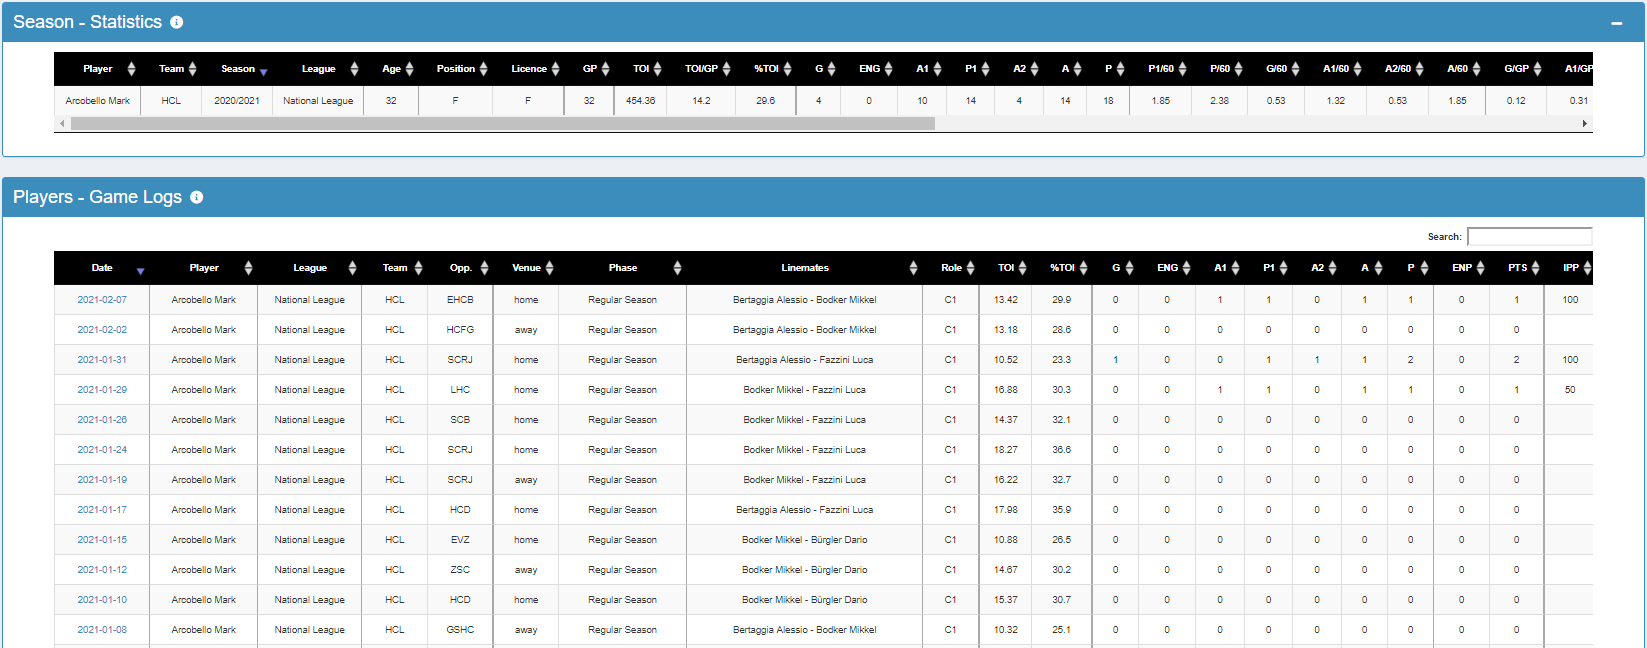
Season - Statistics
Players - Game Logs
Filters
Players - Statistics
Filters
Explanations and use
Betweenness - Explanations
In the context of quantifying players’ scoring influence, betweenness is a concept introduced in hockey by @OppenheimerEvan in July 2018, in this piece. Basically, as simply put by Oppenheimer here, “the basic idea of betweenness is to try and quantify how much a player drives their & their team’s scoring based on how many goals/lightblue assists they get and who they score/get lightblue asssits with”.
Now, to be more a bit more precise, let’s get back to Oppenheimer’s piece on betweenness: “In terms of hockey, a player will have a high betweenness centrality score if:
- The player scores and assists on a lot of goals
- The player scores and assists on many distinct players’ goals
- A player’s teammates rely on the player for their scoring, such that the teammates’ goals and assists tend to only occur with that player directly involved
- The player fulfills some combination of the above requirements more than that player’s teammates do”.
In the NHL, think about the Thornton/Cheechoo or Tavares/Moulson duos, where Moulson and Cheechoo mostly benefited from their teammates’ play rather than the contrary, where both Tavares and Thornton also scored a lot with other players.
This measure can be easily computed in leagues displaying who scored and who assisted on the goals scored, which is the case here in Switzerland and in most leagues around the world. As more advanced data is often lacking in most junior leagues, this measure can provide another layer of context to players’ performances.
Additional information
To fully understand what this statistic can and cannot do, the following points are key (you can find them in Oppenheimer’s piece):
- The statistic should be seen as descriptive;
- Unassisted goals are not considered in the betweenness computation. Yet, as stated below, they only represent 6% of all goals scored;
- Players don’t choose their linemates;
- For players on offensive talented teams, as stated by Oppenheimer, they “may appear to be less influential in terms of scoring than they truly are”;
- Most goals are scored at even-strength, as such, betweenness in power-play situations should be considered with greater care;
- Even if goals or assists may be seen as random events, it shouldn’t refrain us to add more context to some of the most used statistics in hockey, especially in the absence of more pertinent data.
How to read the chart
The chart should be read from the left to the right, with the seconary assist on the left, the lightblue assist in the middle and the goal on the right. Now, goals can have two assists (77% of the time), one assist (17% of the time) or be unassisted (6% of the time). For these two last cases:
- Goals with one assist: A2 is replaced by A1;
- Goals with no assist: A1 and A2 are replaced by the goal scorer.
The ticker the size of the line, the more assists between two players.
By default, the chart displays the scoring network for the complete season. With the Games (Graph) filter, you can restrict the chart to the games played by the selected player, if any.
How to read the table
On the left, you’ll find information you can already have in the Statistics | Players tab. On the right of the betweenness column, the headers indicate the jersey of every player in the selected team. In the cells, you can find the number of goals both players were involved in together.
By default, the table displays all the goals both players were involved in. With the Points (Table) filter, you can restrict the number of goals were either one of the player is the goal scorer and the other the player with the lightblue assist.
Data
A few notes on data:
- Empty-netter points (goals and assists) are excluded from both the table and chart;
- For each player, betweenness is only computed in games they played;
- Betweenness is not computed for shorthanded situations;
Players - Scoring Network
Table
Choose your table: Standard or Shootouts.
Filters
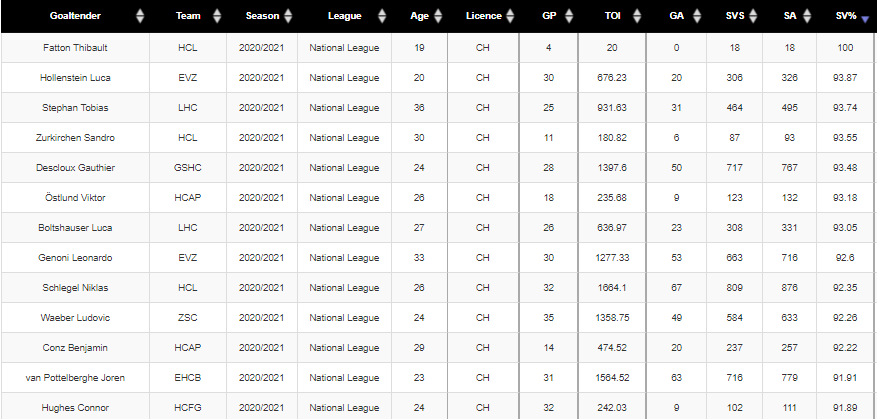
Goaltenders - Statistics
Table
Filters
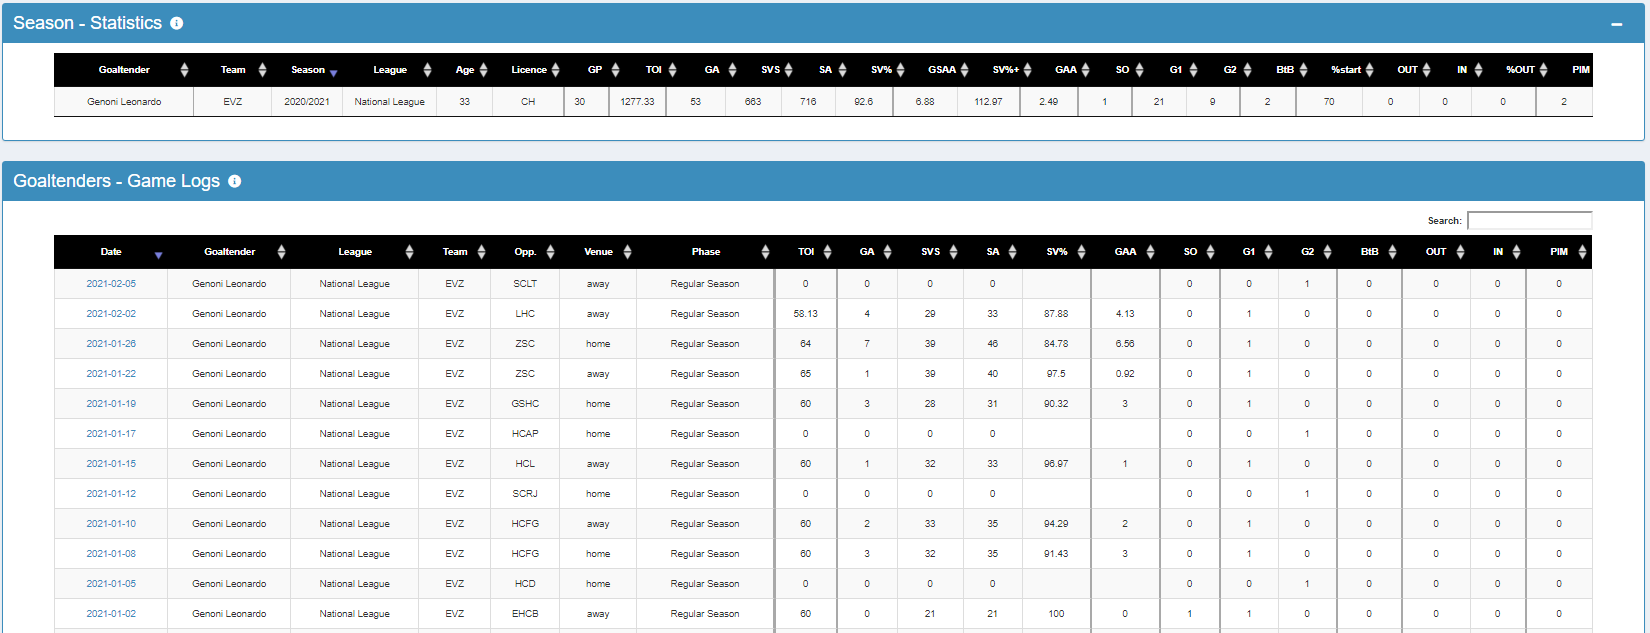
Season - Statistics
Players - Game Logs
Filters
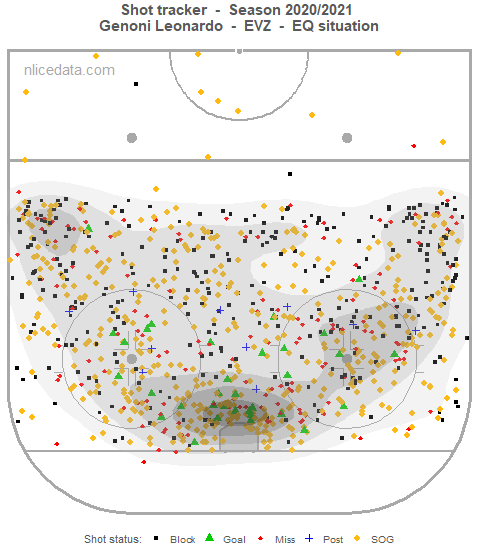
Goaltenders - Statistics
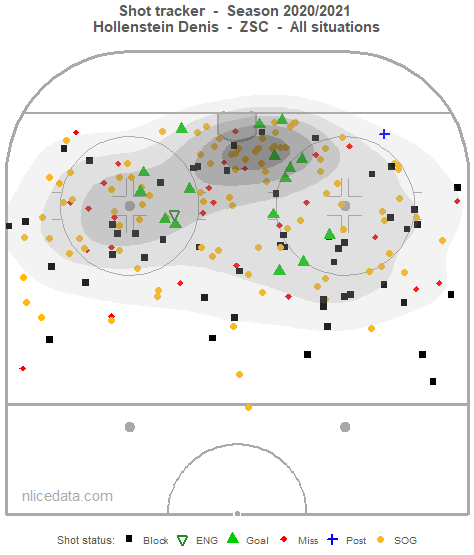
Interpretation
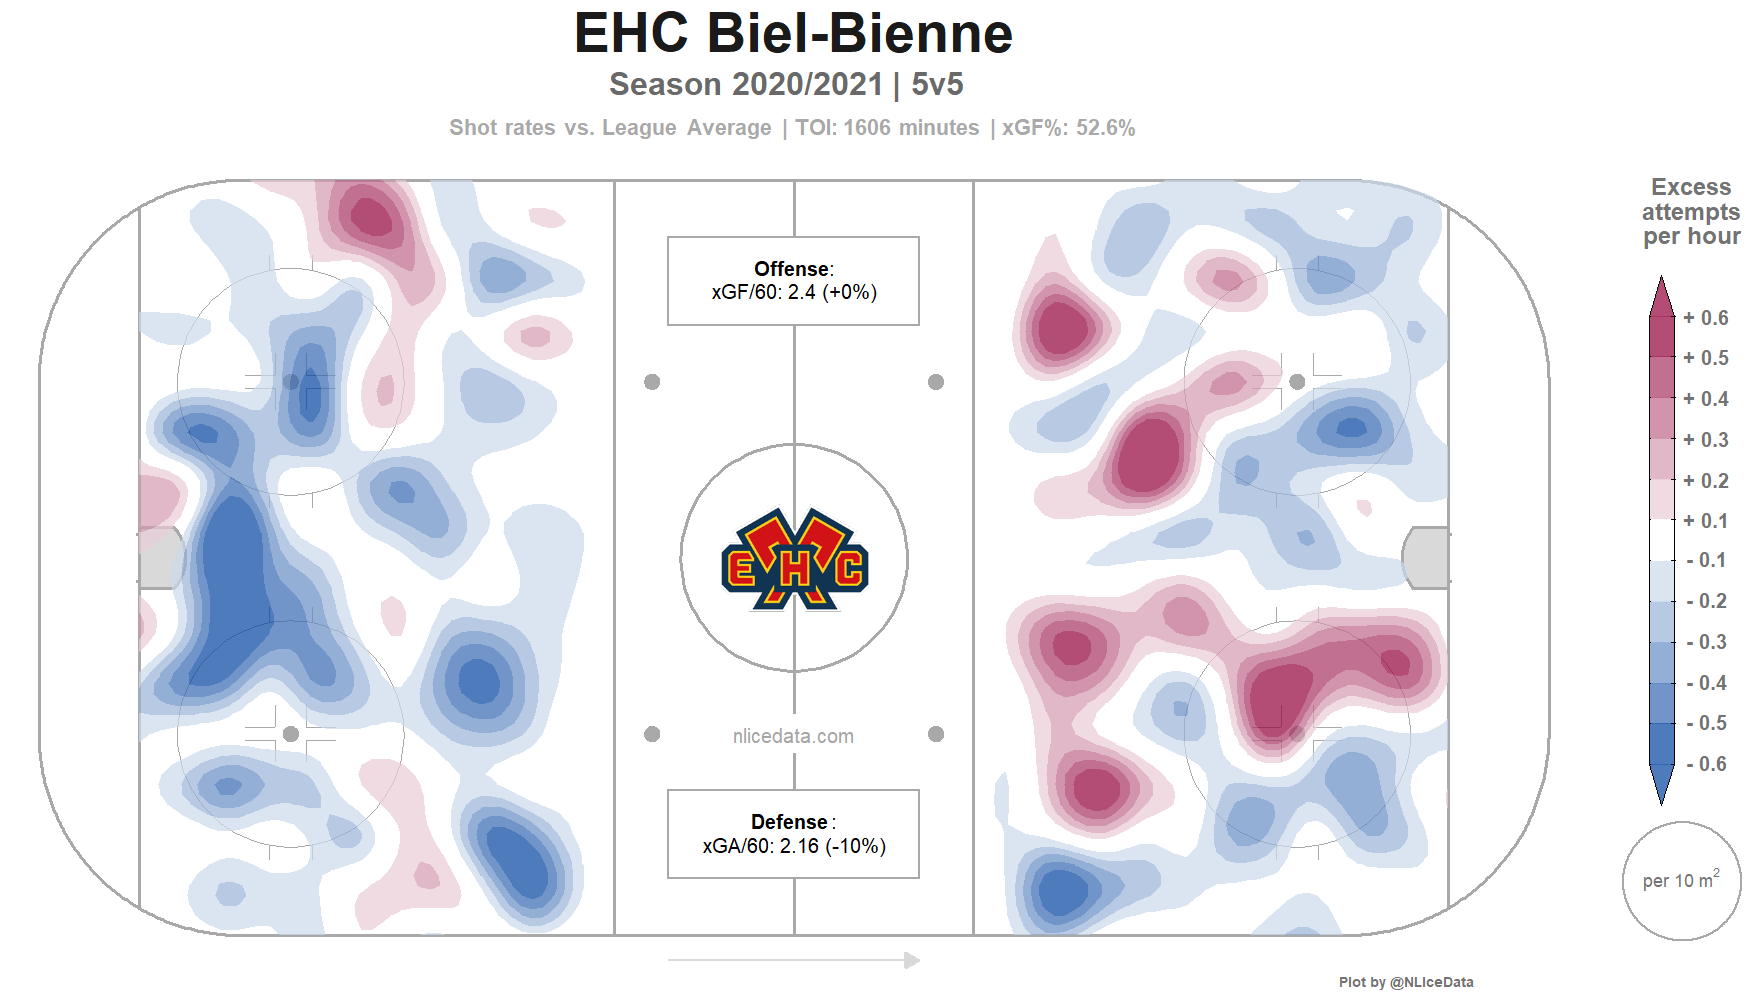
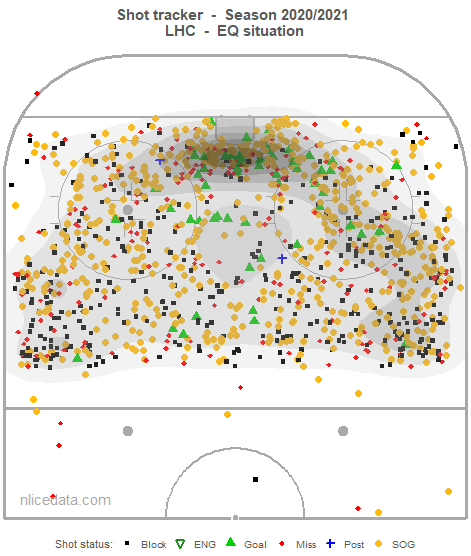
The grey areas indicate the places where opposite players generate their chances from and darker areas indicate where opposite players generate the greatest proportion of their shots from. However, when comparing the shooting distributions of opposite players' shots, a darker area will not necessarily indicate that the goalie is receiving relatively more shots from that area, but simply that a greater proportion of the shots he's facing is coming from that area.
Filters
Pull Time per coach
Coaches - Statistics
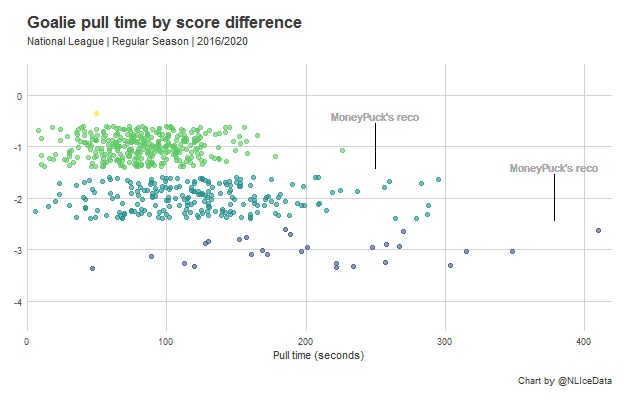
Pull Time per Goal Difference
Game Logs
Definitions
Table
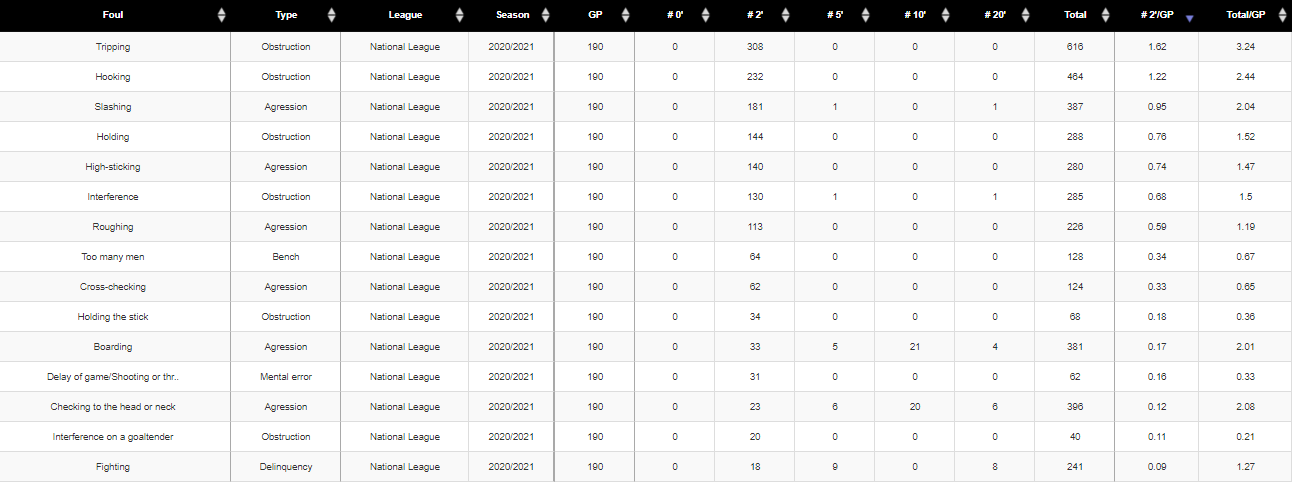
Choose your table: Standard, Shots, Fouls or Shootouts.
Filters
Teams - Statistics
Table
Filters
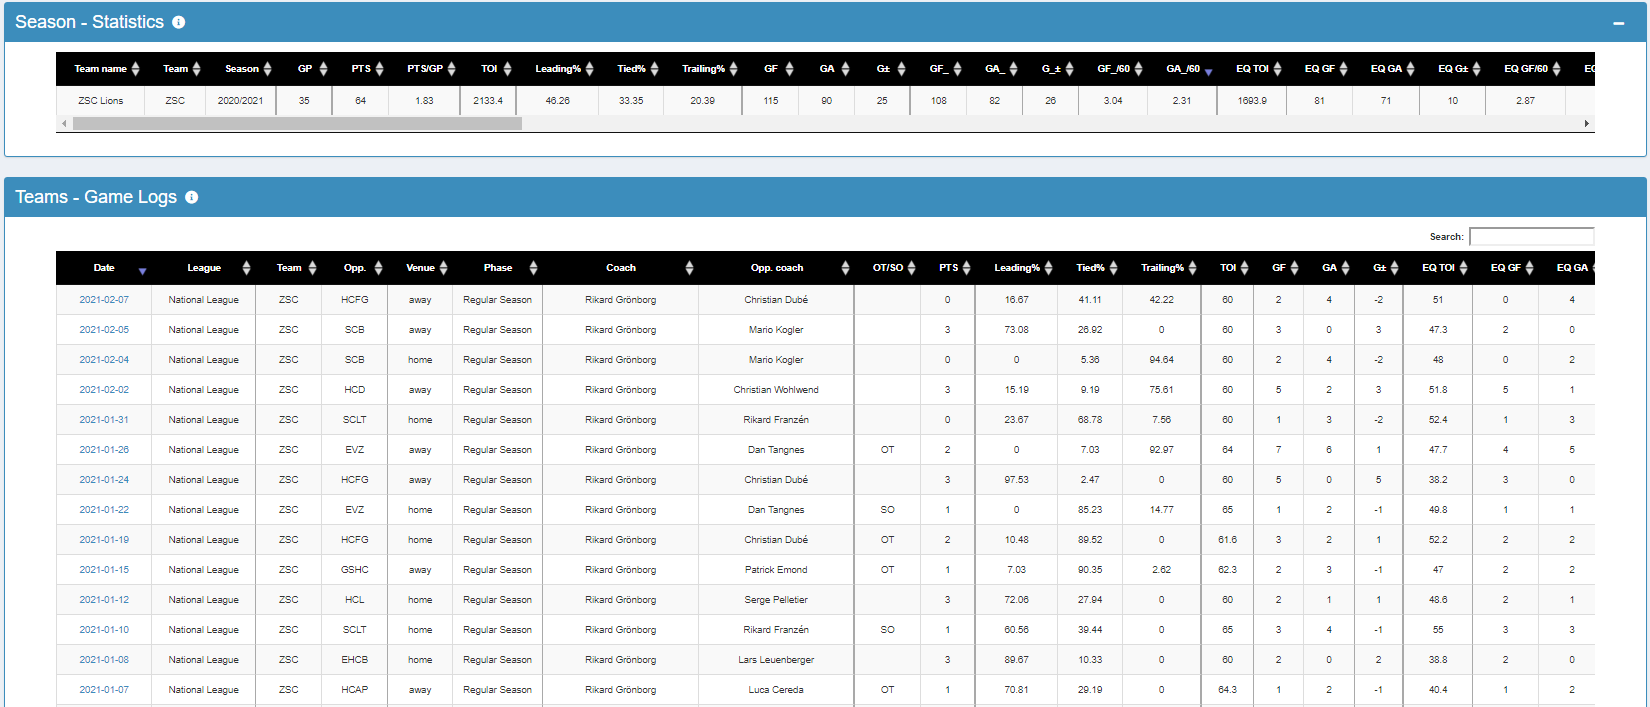
Season - Statistics
Teams - Game Logs
Filters
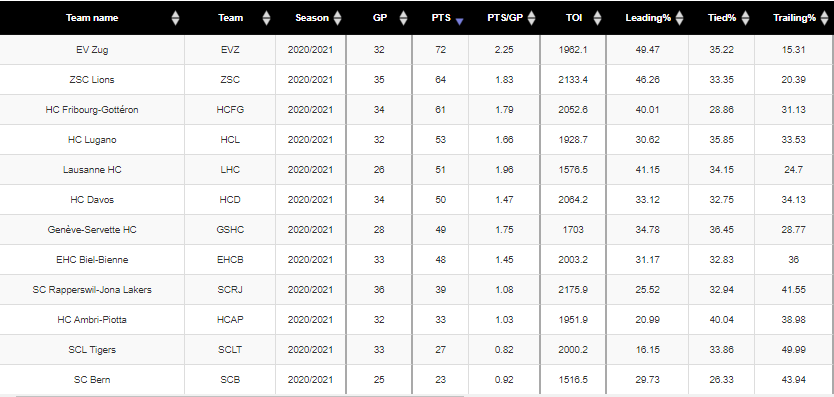
Teams - Statistics
Teams - Statistics
National League | Season | 2025/2026
Disciplinary
Filters
Disciplinary - Principles, Regulations and Documentation
Functions and Actors in Disciplinary Procedures (Elite Sports)
Procedures and Processes
Appeals
III. Disciplinary
PDF versions
IV. Functions + Actors
PDF versions
V. Procedures + Processes
PDF versions
- English version
- German version V. Das Disziplinarverfahren - PDF German
VI. Appeals
PDF versions
- English version VI. Appeals - PDF English
- German version VI. Rechtsmittel - PDF German
Filters
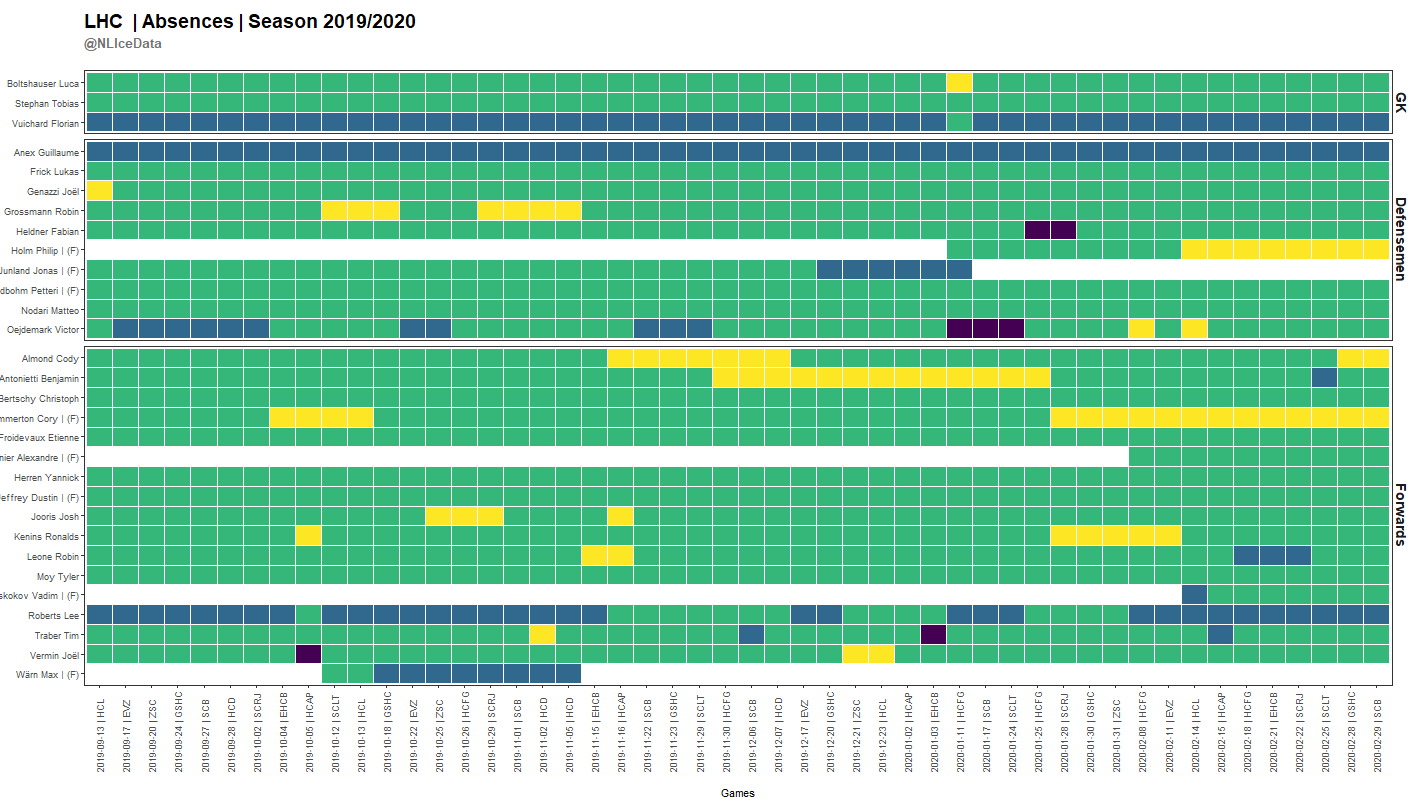
Absences
Filters
Schedule
Number of games remaining
Filters
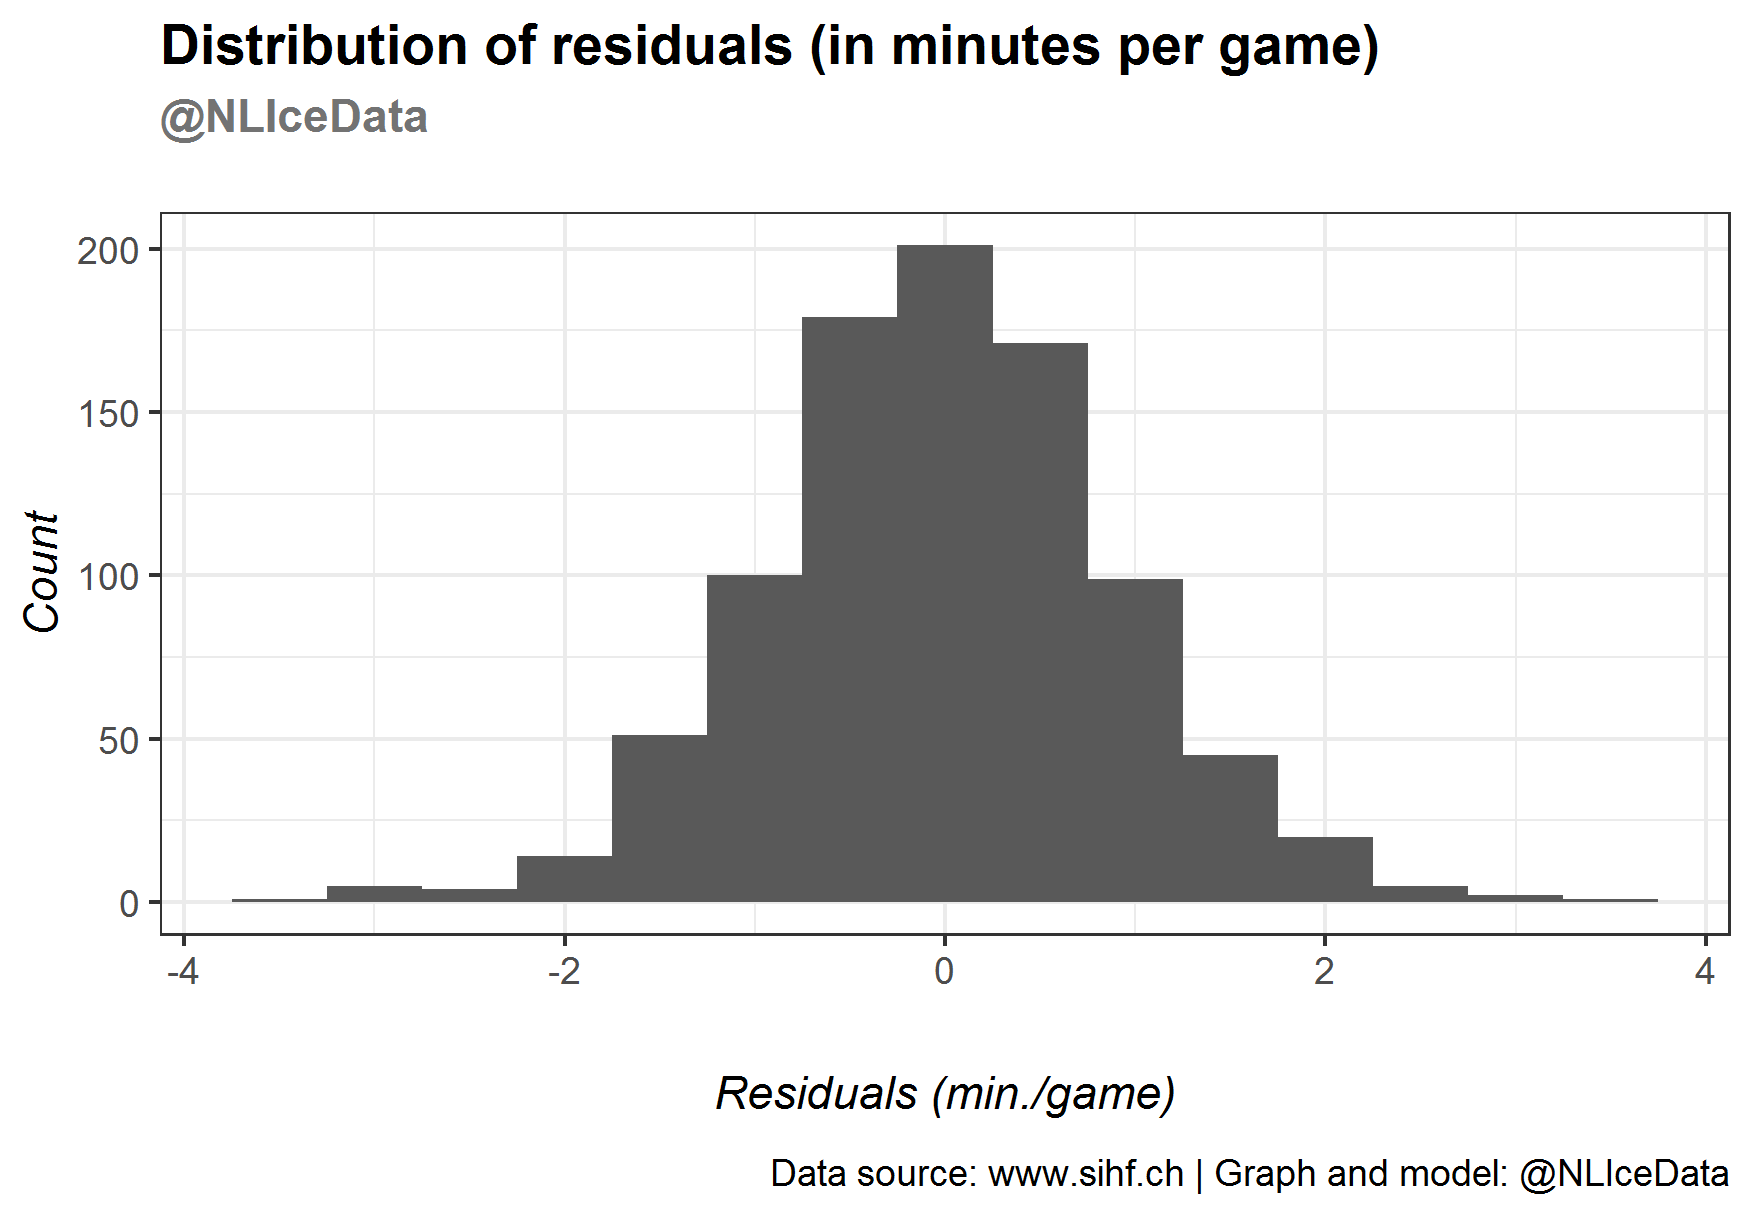
eTOI - Estimated time on ice
[For this table, and some others below, the last three columns (RMSE - TOI%, RMSE - TOI, RMSE - TOI/GP) all represent the same information, but in a different unit. RMSE - TOI% is in the same unit as the TOI% from the model, RMSE - TOI is in minutes, and RMSE - TOI/GP is in minutes per game played.]
[Norm% is discussed below. TOI% represent the proportion of a team's total even-strength time on ice played by each player. [F] indicates import players.]
And for defensemen:
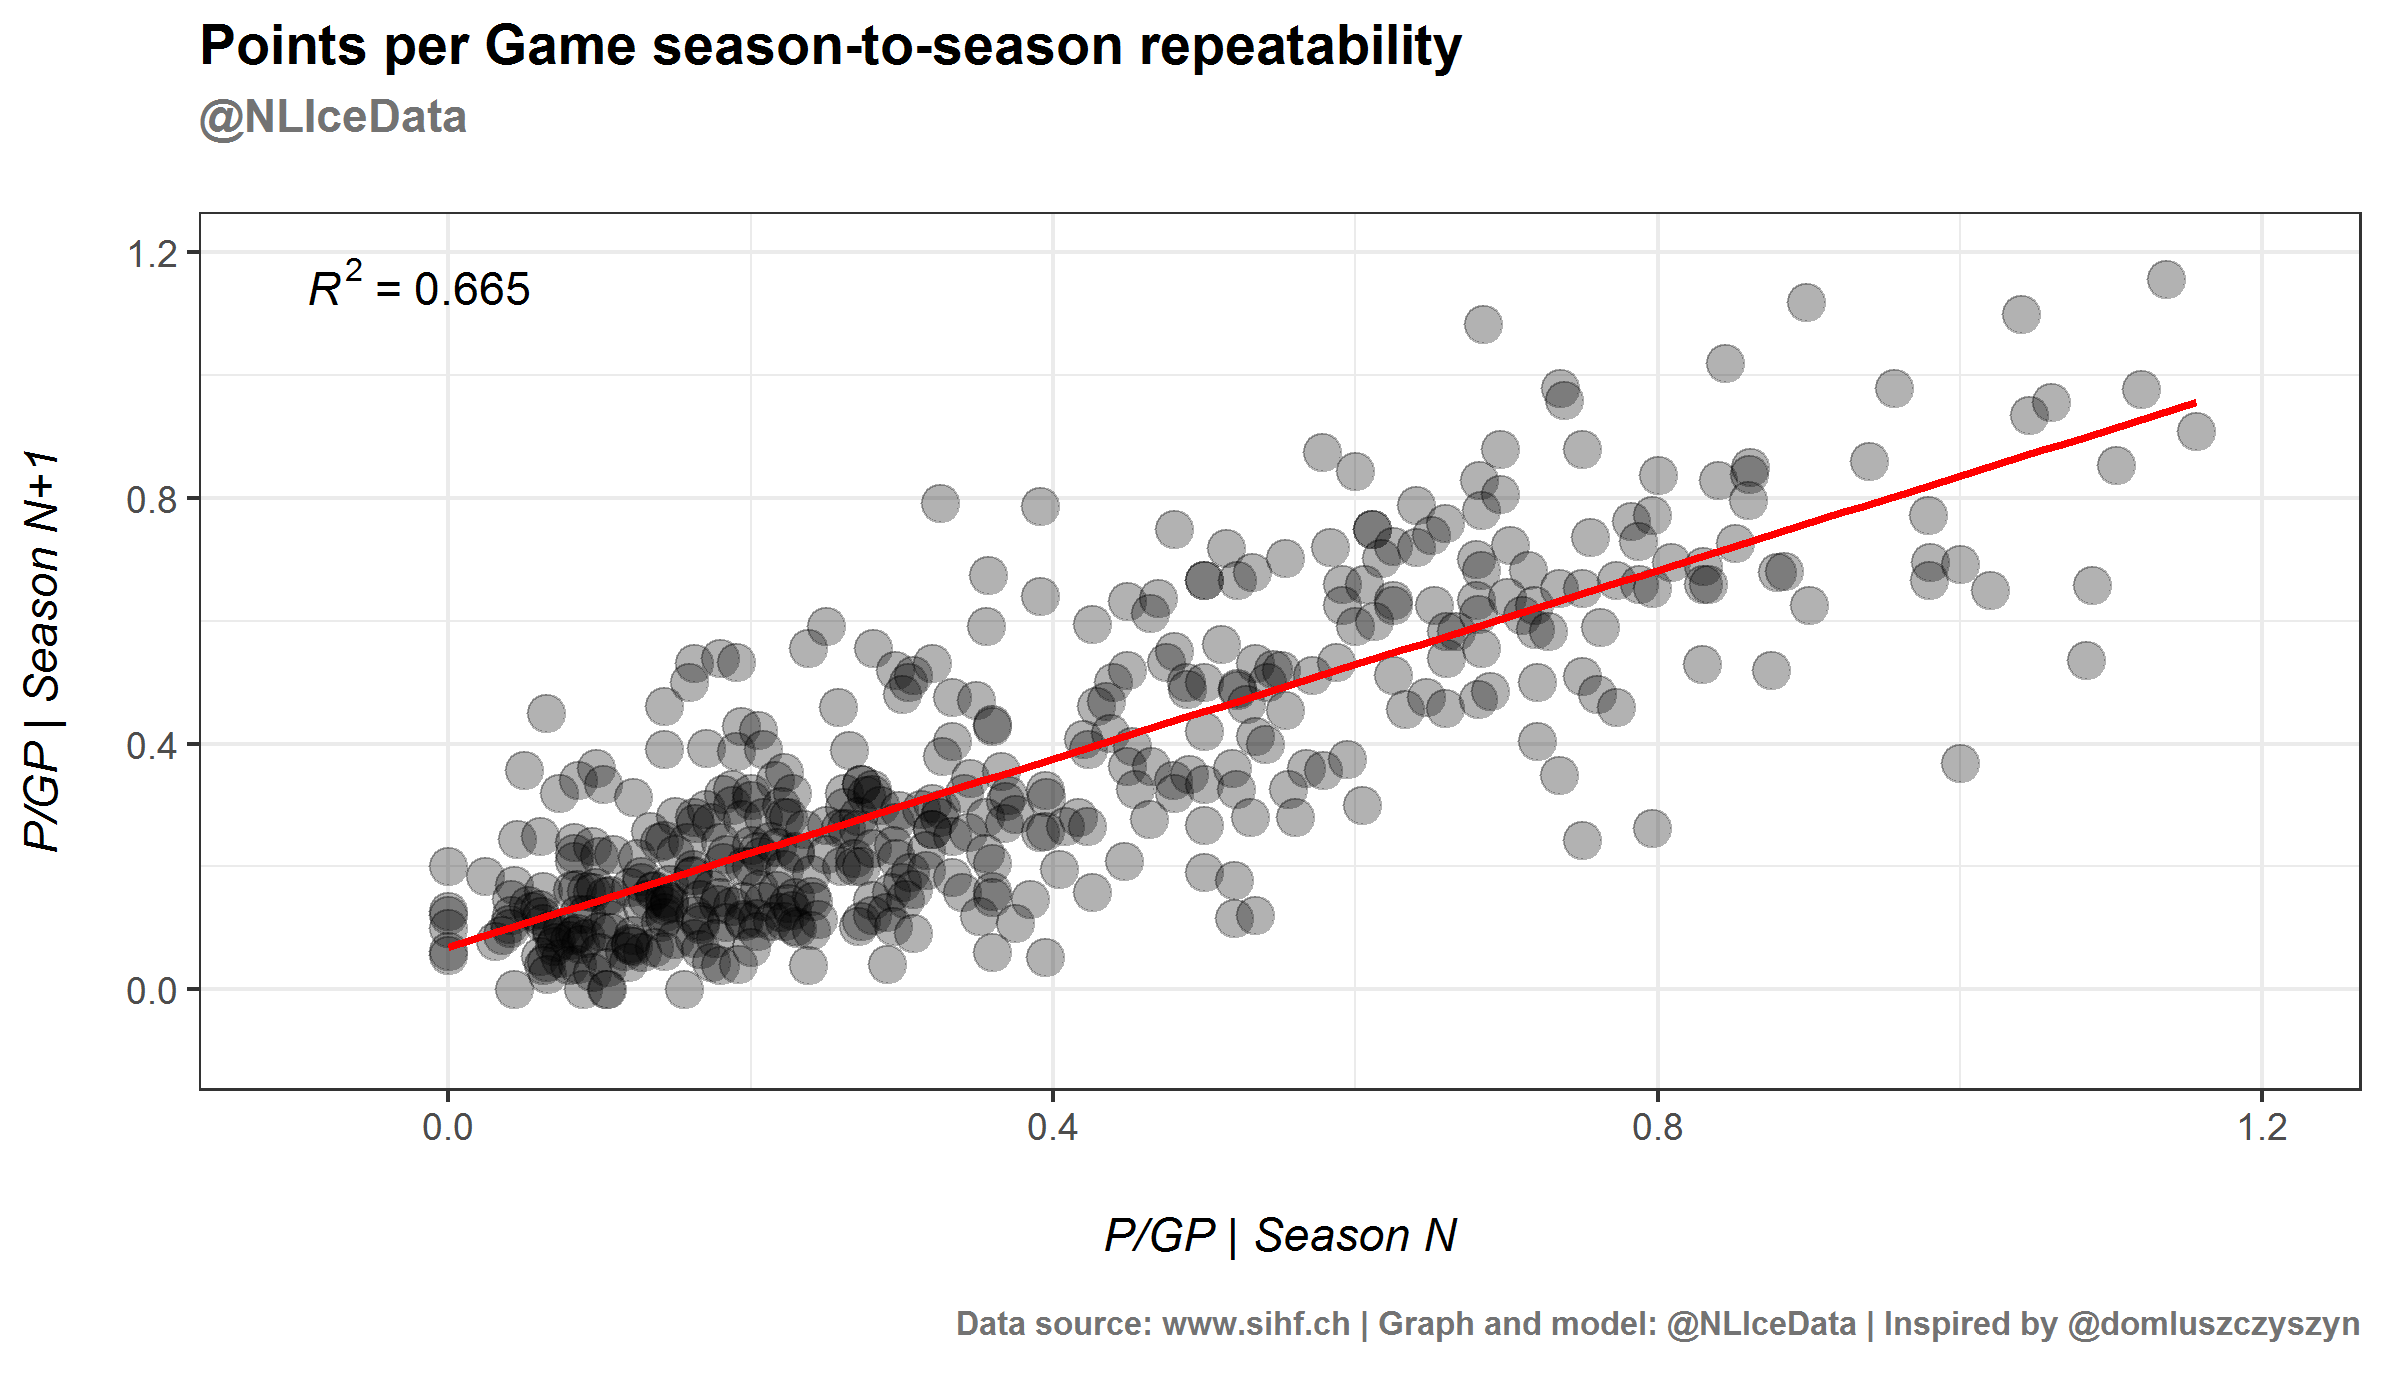
Game Score for the National League and Swiss League
[GF/GA statistics are completely unreliable for at least seasons 2008/09 to 2010/11 and are as such not considered.]
And for goalies:
Now, for the Swiss League:
Site Map
- Subscribers
- Articles
- Game reports
- Games and Standings
- GM
- Teams - Statistics
- Players - Statistics
- Goaltenders - Statistics
- Hockey Manager
- Players
- Players - Statistics: Standard, Shots, Fouls or Shootouts.
- Players - Game Logs
- Players - Shot Maps
- Players - Scoring Network
- Goaltenders
- Goaltenders - Statistics: Standard or Shootouts.
- Goaltenders - Game Logs
- Goaltenders - Shot Maps
- Pull the goalie
- Teams
- Teams - Statistics: Standard, Shots, Fouls or Shootouts.
- Teams - Game Logs
- Teams - Shot Maps
- Projections - National League
- Disciplinary
- I. Introduction
- II. Statistics
- III. Disciplinary
- IV. Functions + Actors
- V. Procedures + Processes
- VI. Appeals
- Documents
- Others
- Absences
- Schedule
- Fouls - Statistics
- Research
- eTOI - Estimated time on ice
- Game Score for the National League and Swiss League